UDP packet tracing with eBPF
Introduction
This blog post gives an overview of how to trace down the way of an udp packet from calling sendto in userspace till the packet is finally transmitted.
eBPF
eBPF is the abbreviation for extended Berkeley Packet Filter. For tracing eBPF is used. eBPF is an in kernel virtual machine and fulfills various use cases, for example network packet filtering or tracing. There are various ressources about eBPF available, I’ve listed some of them in the ressources section.
BPFTrace
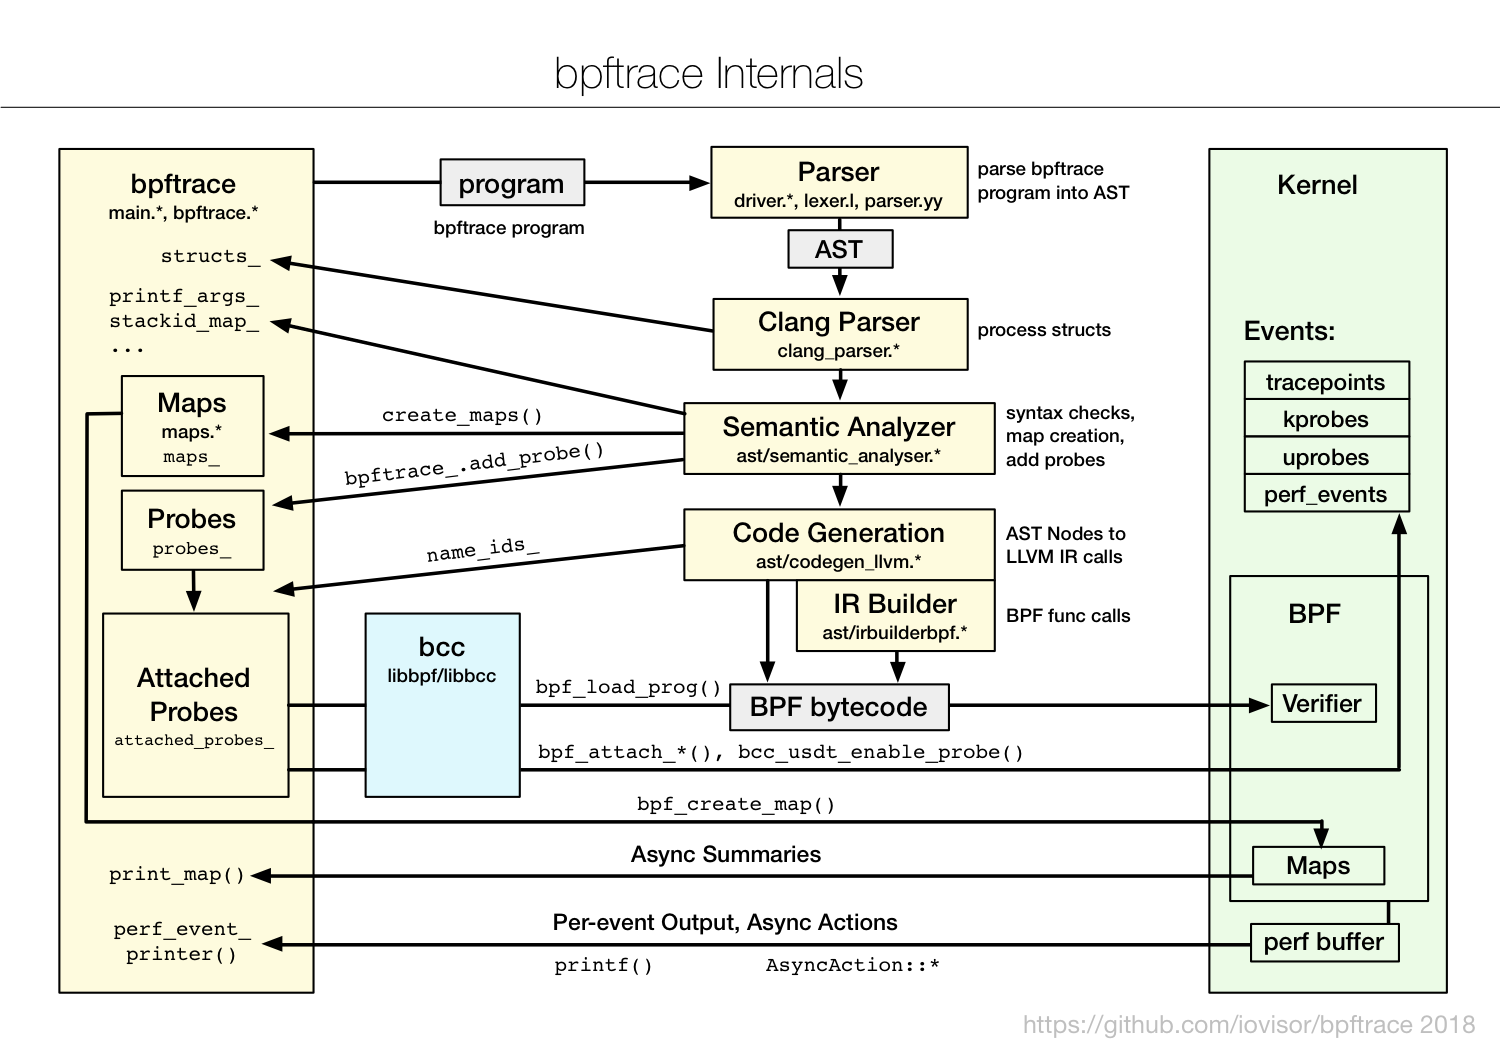
For writing and downloading to the kernel BPF the trace program, bpftrace is used. BPFTrace programs are written in a high level language (if you consider C a high level language ;))
Probe types
eBPF supports different probe types, here is a list of the important ones:
- tracepoints: are static, compiled into the kernel. System calls are instrumented with them.
- kprobe: are dynamic, kernel functions can be instrumented at runtime with them.
- uprobe: like kprobe also dynamic, but for user space
- USDT (user level static defined tracing): a user space version of tracepoints
Dynamic instrumentation (like kprobes and uprobes) costs zero overhead, when not in use.
Looking up probes
Probes can be looked up with bpftrace -lv “*nameOfProbe*“ for example:
sudo bpftrace -lv "*sendto*"

tracepoint:syscalls:sys_enter_sendto
    int __syscall_nr;
    int fd;
    void * buff;
    size_t len;
    unsigned int flags;
    struct sockaddr * addr;
    int addr_len;
tracepoint:syscalls:sys_exit_sendto
    int __syscall_nr;
    long ret;
kprobe:__sys_sendto
Tracepoints also return there parameters.
Prerequisites
eBPF for this examples requires a linux kernel >=4.x compiled with this config options, I’ve run the examples on a 4.19 kernel. There is a script called check_kernel_features in whick checks if the requirements are fullfiled.
Way of an UDP packet through kernel
Generating traffic
For generating udp traffic, open62541 is used. OPC UA supports the publish-subscribe pattern over different encodings and transport, one of them is binary encoding over udp. I’ve used the tutorial_pubsub_publish for generating udp packets. Simply clone the repo and build with examples enabled and start the publisher.
git clone https://github.com/open62541/open62541.git
cd open62541
mkdir build && cd build
cmake -DUA_BUILD_EXAMPLES=ON -DUA_ENABLE_PUBSUB=ON ..
make -j
bin/examples/tutorial_pubsub_publish
So, now the publisher should run. We can inspect this with the perf command and taking a look on the system calls of the publisher:
pidof tutorial_pubsub_publish
20488
sudo perf trace -p 20488
- 949.690 (50.166 ms): select(n: 6, inp: 0x7ffc4b80af50, exp: 0x7ffc4b80aed0, tvp: 0x7ffc4b80aeb0) = 0 Timeout
- 999.875 ( 0.005 ms): clock_gettime(which_clock: MONOTONIC_RAW, tp: 0x7ffc4b80ae20          ) = 0
- 999.886 ( 0.003 ms): clock_gettime(which_clock: MONOTONIC_RAW, tp: 0x7ffc4b80b040          ) = 0
- 999.894 ( 0.004 ms): clock_gettime(which_clock: MONOTONIC_RAW, tp: 0x7ffc4b80b040          ) = 0
- 999.931 ( 0.083 ms): sendto(fd: 3<socket:[452663]>, buff: 0x7ffc4b80acb0, len: 39, addr: 0x55cab43df720, addr_len: 128) = 39
We see that we get some clock_gettime, a select and the sendto systemcall. What we are interested, is the latency of the sendto systemcall, that means the delay from the sendto call and when the datagram leaves the network interface. For that, we have to know a little bit about how linux kernel networking works.
High level view on network data and possible tracepoints
- user space: UA_WriterGroup_publishCallback
- system call (sendto, sendmsg, …) tracepoint:syscalls:sys_enter_sendto
- socket subsystem
- Protocol layers, in our case UDP and IP kprobe:ip_send_skb
- Device agnostic layer
- device drivers transmit function is called
- data is passed on to the queue discipline (qdisc)
- data is transmitted directly or it is queued and sent during NET_TX softirq
- once transmission is complete, net device raises interrupt to signal transmit completion
- packet data is freed tracepoint:skb:consume_skb
bpftrace program
BPFTrace is used to write this latency tracing program, it can be found here
sendto and ip_send_skb are called in process context, consume_skb is called in context of an kernel thread. We save the time when the sendto system call is called, associate it with the socket buffer in kprobe:ip_send_skb and calculate the difference in tracepoint:skb:consume_skb.